Wednesday, October 21, 2015

Despite Mandated Transparency, Off-Campus Housing Costs Remain Unclear

By Nicholas Dias
niccdias@gmail.com


Presidential candidates have been pumping the ether full of talk about college inaccessibility and plans to ameliorate those circumstances. And, as most high school seniors with college aspirations would tell you, such talk has basis.

The College Board reports that, between 2004 and 2014, annual costs at public and private four-year colleges increased by 32.3 and 22.7 percent, respectively. The average cost of a college education is now around $70,000 or $170,000, depending on which path one takes at the public-private road fork.

The result? Students have amassed $1.2 trillion in outstanding debt. 17 percent of student loan holders are behind on their payments, and another 14 percent are in default.

Yet, Hillary Clinton and Dr. Ben Carson alike continue to neglect a critical, tractable factor impeding young people from receiving a bachelor’s degree: elusive, faulty college cost information.

Research from Stanford has shown that high-achieving, low-income students shy away from top-tier, aid-heavy colleges because they simply do not know what attendance would actually cost them.

Responding to similar studies, the federal government has required colleges to develop and publish “net price calculators” enabling prospective students to illuminate the costs entailed in attendance. Policy advocates, however, have criticized that these calculators are too unwieldy to be useful.

To compound matters, a recent study from Trulia found that even when colleges do disclose costs, this information can be highly inaccurate.

Trulia’s study examined differences between the reported off-campus housing costs of 20 colleges and the median prices of Trulia rental listings in those colleges’ communities. UC Berkeley, for instance, was found to have underestimated off-campus housing costs by 42 percent—over $5,000. The University of Texas, Austin was found to overestimate costs by 59 percent. (Of course, there are a few caveats about this study, which were well-reviewed by Anna Marie Erwert at SFGate.)

Inaccuracy in any reported college expenses harms in several ways. Overestimation deters some prospective students with ostensibly prohibitive costs. Underestimation is equally problematic, lulling students into a false sense of security and leading them to drop out or be smothered by debt.

Misreports of housing expenses, however, are particularly dangerous considering such costs potentially aggregate tens of thousands of dollars a year. 

But just how widespread is inaccuracy in reported off-campus housing costs? Data from the Department of Education and Rent Jungle offer an idea.
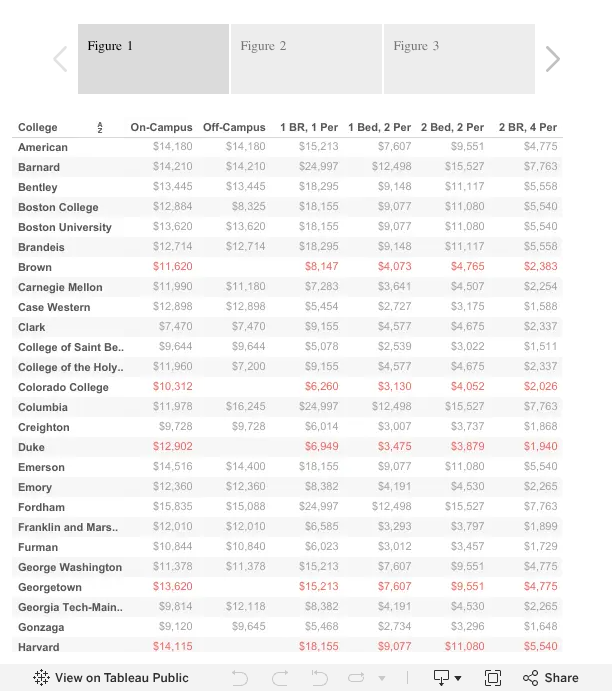


Figure 1 of the visualization juxtaposes each college’s reported off-campus housing costs with rent averages of one- and two-bedroom apartments within a ten-mile radius. Columns are split by the apartments’ number of bedrooms and inhabitants. Red text marks colleges that did not report off-campus housing costs between 2011 and 2014.

Figure 2 visualizes differences between reported off-campus housing costs and calculated costs. Negative values suggest that off-campus housing costs were overestimated.

Finally, Figure 3 charts the average inaccuracy of each college’s reported off-campus housing costs, which is simply the average of absolute values of the differences in Figure 2. Bars are shaded according to college communities’ monthly rent prices.

The sample of colleges used is based on The New York Times' College Access Index. All data are from 2013–14, with the exception of Occidental (2011–12) and Vanderbilt (2012–13). Rent averages were calculated by finding the average monthly rent from the time period and multiplying the result by nine. (Note: The academic year for trimester schools is typically eight months long. Thus, total rent expenses for students of such schools might be slightly smaller.)


Thursday, September 24, 2015

Sociocultural Factors Restrict Sex Equality in Doctorate Recipients?

By Nicholas Dias
niccdias@gmail.com

It is no secret that females have made groundbreaking headway in closing sex gaps – and then some ­– in United States postsecondary institutions since the 1960s.

Popular media have by now thoroughly reported studies showing that female bachelor’s degree recipients now even outnumber their male cohorts. For example, data from the National Science Foundation (NSF) estimates that females constituted around 57 percent of bachelor’s recipients in 2012.

Ironically, articles considering sex equality among master’s recipients are much rarer, despite existing data that contend females do even better in this arena: The NSF data just cited also shows that females earned about 60 percent of master’s degrees awarded in 2012.

Yet, the truly forgotten front in the fight for postsecondary education sex equality is that over doctorates, where several studies have shown trends that are somewhat less encouraging.

A recent post by Joe Boeckenstedt, the Associate Vice President of Enrollment Management and Marketing at DePaul University, illustrates these circumstances. Boeckenstedt’s interactive visualization of 2013 data from the National Science Foundation (NSF) is below.


To be sure, growth in the proportion of female doctorate awardees has been considerable. Between 1983 and 2013, females increased their share of awarded doctorates by over 12 percent, claiming majorities in the humanities, life sciences and social sciences and maintaining their margin in education.

Even with these 30 years of marked progress, however, females still amounted to only 46.25 percent of total doctorate awardees in 2013.

This is because males still greatly overshadowed females among engineering and physical science doctoral graduates, constituting more than 77 and 70 percent of graduates, respectively. In fact, according to the data, sex gaps of doctorate awardees in the two fields increased by just over 40 percent from 2003 to 2013.

The damage of sociocultural elements that daunt females from entering science, technology, engineering and mathematics (STEM) fields is well-documented.

One stand-out study that demonstrates these outcomes is that of Harvard University researchers Kane and Mertz. The researchers compared the Social Watch Group’s Gender Equity Index (GEI) to average math performance of fourth- and eighth-graders in 26 and 52 countries, respectively, as measured by the Trends in International Mathematics and Science Study (TIMSS). Correlations between countries’ GEIs and average female math performances had coefficients exceeding 0.479 (p < .001).

However, shortages of females in engineering and the physical sciences may not be the only reason that females continue to be underrepresented among nationwide doctoral graduates. Some states still lag far behind others with regard to sex equality in total doctoral graduates.


While states such as Vermont can boast percentages of female doctorate recipients topping 56 percent, other states like Wyoming dawdle at rates as low as 33 percent (Figure 1). That is a range of around 23 percent. Females receive about or above their fair share of doctoral degrees in only 16 states.

A multiple regression analysis suggests a few reasons as to why these differences exist.

Each state’s percentage of female doctorate recipients is predicted by two other characteristics: its proportion of self-identified liberals (β = 0.68%, p < .001) and its proportion of females between the ages of 20 and 44 needing contraception (β = -0.47%, p < .05). The correlation between proportions of self-identified liberals and percentages of female doctorate recipients is visualized in Figure 2.

In other words, as states’ percentages of female doctorate recipients rise, (1) their proportions of self-identified liberals also rise and (2) their proportions of females needing contraception fall.

There are several apparently possible implications of these results. Pregnancy may deter females from completing a doctoral education. Liberals may elect representatives that are more inclined to support measures to bring about sex equality in education, or they may be more likely to pursue a doctoral education in-state.


In any case, the statistics doubly underscore the import of considering sociocultural factors in discerning why sex inequality within postsecondary institutions persists in the United States.